

On a GPU inference pod, CPU is a decorrelated proxy: it can sit at 30% while the accelerator is pinned and requests pile up behind it. Scale on the signal actually on the critical path—backlog and GPU utilization—with KEDA.
- On a GPU-served model, the CPU handles tokenization, HTTP, and batch assembly. The work that saturates lives on the accelerator. CPU utilization is a decorrelated proxy.
- A CPU-based HPA can scale at the wrong time: it may sit still while the GPU queue backs up, or scale on request marshalling while the GPU is idle.
- Scale on signals that are causally on the critical path: backlog or queue depth as the leading demand signal, and GPU utilization as a saturation guardrail.
- KEDA is useful because these signals often live outside the pod’s cgroup, where vanilla HPA cannot reach, and because it can scale workloads to zero.
- Scale-to-zero on a multi-gigabyte model has a cold-start cost: model load plus CUDA warmup on the first request.
The Autoscaler That Watched the Queue Burn
A model-serving service I was on-call for had a textbook HPA: targetCPUUtilizationPercentage: 70, minimum two replicas, maximum twelve.
It had passed every load test. Then a real traffic spike hit, and the autoscaler did nothing. Replica count stayed flat at two for eleven minutes while p99 latency went vertical and requests stacked up in front of the model.
I pulled the metrics. CPU on those pods was sitting around 35%. The HPA was, by its own definition, looking at a healthy fleet. Thirty-five percent is nowhere near 70%, so why would it add replicas?
Meanwhile, the GPUs were pinned at 100%, the KV cache was full, and the serving engine’s queue was 47 deep.
The autoscaler was not broken. It was reading the wrong gauge—perfectly. It scaled on CPU, and CPU had nothing to say about the fire.
That is the trap. CPU-based autoscaling on a GPU workload does not fail loudly with an error. It fails silently by being confidently calm about a resource it cannot see.
CPU Is a Decorrelated Proxy, Not a Quiet One
The HPA is not lying out of malice. It reports exactly what it measures. The problem is what it measures.
On a GPU inference pod, the work is split across different hardware:
- The CPU handles request intake, tokenization, HTTP plumbing, and batch assembly.
- The accelerator handles matrix multiplication, GPU memory, KV-cache activity, and the work that most often determines saturation.
Those two are not reliably correlated.
You can be CPU-low and GPU-pinned: requests queue inside the serving engine, the GPU is saturated, and the CPU is barely working because it is waiting on the accelerator.
You can also be CPU-high and GPU-idle: a burst of small requests increases marshalling cost while the GPU sits between batches.
Neither state has a stable relationship to the other.
This is a mechanism argument, not a benchmark claim. The two quantities are not on the same critical path, so a threshold on CPU cannot reliably track GPU saturation, KV-cache pressure, or request backlog.
“Tuning the CPU target lower” does not fix a decorrelated signal. It only moves the noise floor.
Microsoft’s AKS guide illustrates the supported pattern: use the NVIDIA DCGM exporter with Prometheus and scale on DCGM_FI_DEV_GPU_UTIL. That is not an accident of taste. CPU percentage cannot see the resource they need to react to.
Backlog Is the Leading Signal. GPU Utilization Is the Guardrail.
Even after teams stop using CPU, they often make a second mistake: they use only GPU utilization. GPU utilization tells you a replica is busy. It does not tell you work is waiting.
By the time average GPU utilization is pegged, you are already saturated. It is a coincident or lagging signal. Queue depth rises before users are starved.
Backlog is the leading signal. Use it to decide how many replicas you need. Use GPU utilization as a secondary guardrail.
For inference behind a broker such as SQS, Kafka, or RabbitMQ, the backlog signal is already available. KEDA’s AWS SQS scaler reads it directly.
The model is easy to reason about:
Target replicas ≈ ceil(messages ÷ queueLength)
Here, queueLength is the number of in-flight requests that one replica can drain within the desired polling interval.
Set it to 10, and KEDA aims to keep the backlog near 10 requests per pod.
Two SQS settings matter especially for inference:
activationQueueLengthwakes the deployment from zero. Set it to 1 so the first message brings up a replica.scaleOnInFlight, enabled by default, counts received-but-not-yet-deleted messages. This helps prevent scale-down while inference is still in progress.
The Artifact: One ScaledObject, Two Signals, Scale-to-Zero
This KEDA ScaledObject uses SQS backlog as the primary demand signal and DCGM GPU utilization from Prometheus as a saturation guardrail.
KEDA evaluates both and scales to satisfy the larger replica recommendation.
apiVersion: keda.sh/v1alpha1
kind: ScaledObject
metadata:
  name: llm-inference
spec:
  scaleTargetRef:
    name: llm-inference
  minReplicaCount: 0
  maxReplicaCount: 20
  cooldownPeriod: 300
  triggers:
    - type: aws-sqs-queue
      authenticationRef:
        name: keda-aws-credentials
      metadata:
        queueURL: https://sqs.us-east-1.amazonaws.com/123456789012/inference-requests
        queueLength: "10"
        activationQueueLength: "1"
        awsRegion: us-east-1
    - type: prometheus
      metadata:
        serverAddress: http://prometheus.monitoring.svc:9090
        query: avg(DCGM_FI_DEV_GPU_UTIL{deployment="llm-inference"})
        threshold: "75"
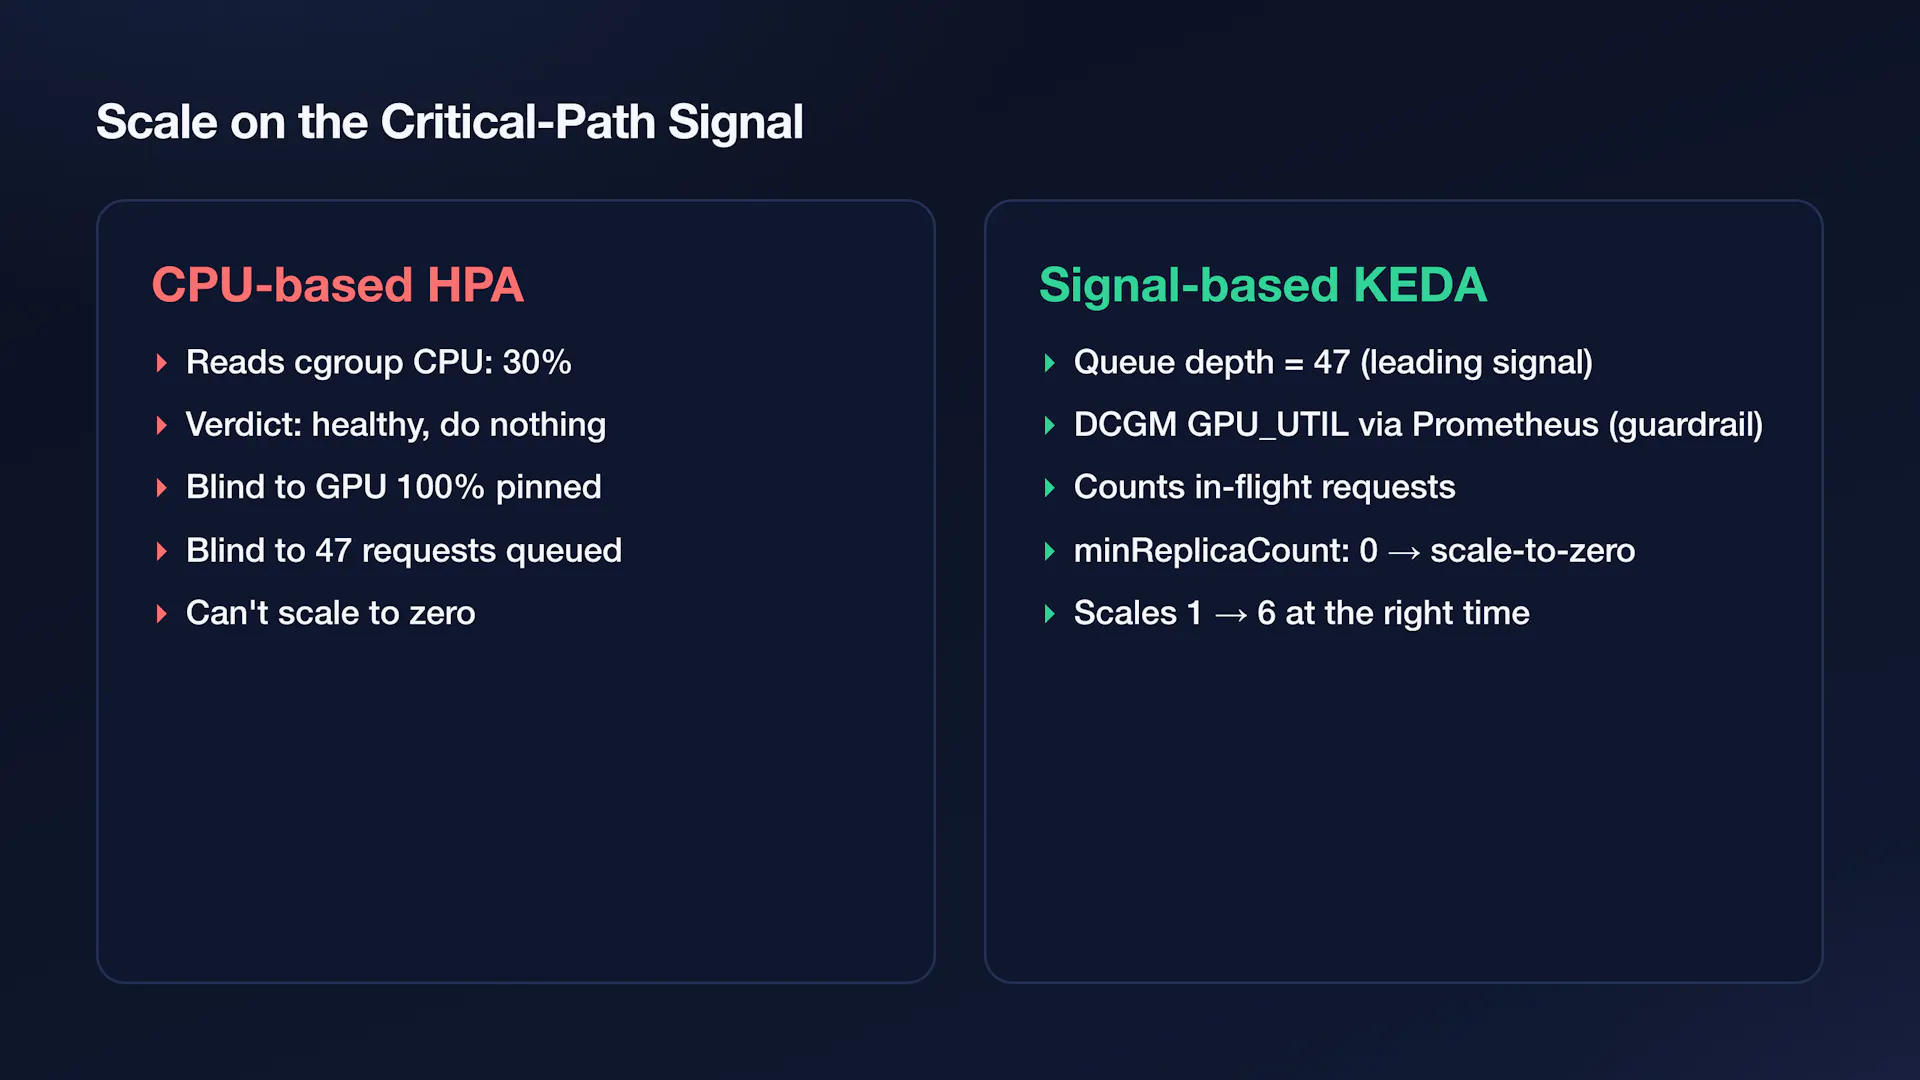 CPU-based HPA versus backlog-and-GPU-based KEDA scaling
Two implementation details are worth calling out.
First, threshold: "75" is a practical starting range for real LLM serving. Some tutorials use values as low as 5 so a lab demo scales immediately. That is not a production recommendation. A 70–80% threshold is more realistic, but it should be tuned against your model, batching behavior, and latency target.
Second, older KEDA examples may include metricName in the Prometheus trigger. Current KEDA scaler references do not require it; KEDA generates the external metric name automatically.
If your model is a synchronous HTTP service without a broker, SQS is not the right signal. Use KEDA’s HTTP add-on to scale on pending and in-flight requests instead. The principle remains the same: backlog is the leading demand signal.
Scale-to-Zero Is a Cost Lever With a Cold-Start Tax
The YAML line that changes the bill is:
minReplicaCount: 0
Native HPA cannot scale a Deployment to zero. KEDA can.
KEDA manages the transition from zero to one replica and, for one-to-many scaling, generates and manages a standard HPA using external metrics.
When the queue is empty and the GPU remains idle beyond the cooldown period, KEDA can reduce the deployment to zero and release expensive GPU capacity.
For accelerators that sit idle overnight, this can be one of the largest cost levers available.
But scaling from zero is not free.
The first request may wait for:
- Kubernetes scheduling;
- GPU node availability;
- a multi-gigabyte model to load into GPU memory;
- CUDA initialization and warmup;
- KEDA polling.
That delay can be seconds to tens of seconds, depending on the model and environment. Scale-to-zero is a good fit for batch and bursty asynchronous workloads, where a cold start is amortized over a queue.
For latency-sensitive synchronous inference with a strict time-to-first-token SLO, keep a warm floor with minReplicaCount: 1, then use backlog and GPU utilization to scale upward.
Do not let “saves money” override “users are waiting.”
Do Not Confuse the Trigger With Placement
One boundary keeps the architecture clear: Choosing when to add a replica is different from deciding where that replica runs.
KEDA decides the replica count.
When a new replica requires a GPU, and none are free, the cluster autoscaler provisions a GPU node and the scheduler places the pod.
GPU bin-packing, MIG, time-slicing, and gang scheduling are separate concerns.
This article is about the trigger signal. Get that signal right, and the placement layer receives a sensible number of pods to schedule. Get it wrong, and even the best scheduler will place replicas too late—or never receive the signal to place them at all.
Takeaways
- CPU on a GPU inference pod is decorrelated, not merely noisy. It runs on different hardware from the resource that typically saturates.
- Scale on backlog first. Queue depth rises before users feel the impact. Use it to determine replica count.
- Use GPU utilization as a guardrail. It catches saturation that queue depth alone may not reveal.
- Use KEDA for external signals and scale-to-zero. It can read broker and Prometheus metrics that traditional CPU-based autoscaling does not.
- Treat scale-to-zero as a cost-versus-latency decision. It is excellent for batch workloads but may create unacceptable cold starts for interactive inference.
- Trigger does not equal placement. KEDA decides how many replicas to run; the cluster autoscaler and scheduler determine where they go.
Your CPU graph may stay calm through the next GPU saturation event. It is not lying on purpose. It is answering a question you should stop asking.
Point the autoscaler at the queue and the GPU, and let it respond to the fire instead of the smoke detector in the wrong room.
This article was originally published by Sneha Gullapalli on HackerNoon.